Showing posts with label Chiba. Show all posts

Sunday, April 29, 2012

Breaking down the environmental radioactivity monitoring data from MEXT (Ministry of Education, Culture, Sports, Science and Technology and whatnot)

As reported in the Asahi:

The science ministry has begun posting real-time radiation levels on its website at 2,700 locations across Fukushima Prefecture, including schools and parks.
To access radiation levels measured at 10-minute intervals, go to http://radiomap.mext.go.jp/ja/.
http://ajw.asahi.com/article/behind_news/social_affairs/AJ201202220028

A picture of the equipment:
https://dwqovw6qi0vie.cloudfront.net/article-imgs/en/2012/02/22/AJ201202220028/AJ201202220029M.jpg

Checking out today's data at
http://radioactivity.mext.go.jp/map/ja/area.html

Let's do some math...

Consider the maximum acceptable radiation dose for the public from any man-made facility: 1 mSv/year.
1 mSv/year is 1000 μSv/year.
1000 μSv/year is 0.114 μSv/h.
(Based on 8766 hours in a year (24×365.25) and 1000 microsieverts(μSv) in a millisievert (mSv).
Therefore any place with over 0.114 μSv/h is questionable.

Japan set a limit 20 times higher, 20mSv/year, for Fukushima residents.

Residents exposed at that level would reach the 350 mSv/lifetime limit which was used to determine evacuation areas after the Chernobyl disaster within 18 years.
Using the Chernobyl lifetime standard, calculating for a 10-year old child with an additional 70 years life expectancy, 350mSv/70years = 5mSv/year.

Recapping, the 1 mSv/year international standard is exceeded by the Chernobyl evacuation standard, which (if judged to be tolerable) could conceivably justify 5 mSv/year for kids (twice that for 35-year-olds, etc.), and that was exceeded by the 20 mSv/year Japanese Fukushima-only standard, which I believe was set at that level for political reasons only, to set a standard that would avoid the need to evacuate several large cities and partially sever northern Japan from the south and middle.

Some selected ranges of readings for locations today, Sunday, April 29, 2012:

Fukushima-ken locations:
MinamiSoma     0.080 - 5.036 μSv/h = 0.701 - 44.14 mSv/year
Fukushima City     0.092 - 1.764 μSv/h = 0.806 - 15.46 mSv/year
NihonMatsu     0.113 - 1.324 μSv/h = 0.990 - 11.60 mSv/year
Koriyama     0.067 - 1.379 μSv/h = 0.587 - 12.08 mSv/year
Sukagawa City     0.098 - 0.727 μSv/h = 0.859 - 6.372 mSv/year
Soma City     0.093 - 1.125 μSv/h = 0.815 - 9.862 mSv/year
Iwaki City     0.054 - 0.819 μSv/h = 0.473 - 7.179 mSv/year
Aizu-Wakamatsu     0.054 - 0.290 μSv/h = 0.473 - 2.542 mSv/year

Outside Fukushima-ken:
Tochigi-ken     0.036 - 0.593 μSv/h = 0.315 - 5.198 mSv/year
Miyagi-ken     0.033 - 0.367 μSv/h = 0.289 - 3.217 mSv/year
Ibaraki-ken     0.048 - 0.178 μSv/h = 0.420 - 1.560 mSv/year
Chiba-ken     0.037 - 0.172 μSv/h = 0.324 - 1.507 mSv/year
Gunma-ken     0.026 - 0.154 μSv/h = 0.228 - 1.349 mSv/year
Saitama-ken     0.027 - 0.154 μSv/h = 0.236 - 1.349 mSv/year
Tokyo-to     0.037 - 0.064 μSv/h = 0.324 - 0.561 mSv/year

If you use the lifetime-exposure evacuation standard for Chernobyl applied to children, all children should be evacuated from all of the cities measured in eastern Fukushima prefecture, with the exception of Aizu-Wakamatsu, which is more central, but which still exceeds the 1 mSv/year international standard for the nuclear power industry. Some sites in Tochigi prefecture also exceed the Chernobyl standard and should evacuate children.

All of these prefectures in the Kanto region have at least a few MEXT radiation measurement stations (which are very limited in number outside Fukushima, by the way, 5 stations in Tokyo, 7 in Chiba, etc) which record levels above the 1 mSv/year international standard. By that standard, Kanto is barely tolerable.

Numbers here in Chiba:
html at http://radioactivity.mext.go.jp/html/12/12000.html
2012年04月29日 20時00分時点

  • 市原市 県環境研究センター  0.037μSv/h


  • 柏市 市立田中小学校  0.116μSv/h
  • 印西市 市立船穂中学校  0.170μSv/h
  • 香取市 香取市役所小見川区事務所  0.082μSv/h
  • 市川市 市立大柏小学校  0.104μSv/h
  • 館山市 県安房農業普及センター跡地  0.059μSv/h
  • 茂原市 県大気汚染常時監視測定局  0.051μSv/h


  • In Chiba, Kashiwa (柏市) and Inzai (印西市) both exceed the 1 milliSievert/year limit for added radiation from nuclear power.

    Saturday, October 01, 2011

    "Contaminated Zone" in Chiba

    Radiation spread reaches Chiba, Saitama prefectures - AJW by The Asahi Shimbun

    » In Chiba Prefecture, the highest levels of cesium-137, between 30,000 and 60,000 becquerels per square meter, were detected in northern areas, such as Kashiwa, Matsudo, Abiko and Nagareyama. Cesium-137 has a half-life of 30 years.
    In the 1986 Chernobyl nuclear accident, areas with 37,000 becquerels or more of radioactivity per square meter were designated contaminated zones, while levels of 555,000 becquerels or more required forcible relocation.
    In Chiba and Saitama prefectures, the highest radiation levels were 0.2 to 0.5 microsievert per hour. In most other areas, the radiation levels were 0.1 microsievert or less.
    http://ajw.asahi.com/article/0311disaster/fukushima/AJ2011093012746

    Wednesday, July 06, 2011

    船橋 Radiation

    This testing by Funabashi City shows hot spots of around 0.44 and 0.45 microsieverts/hr (μSv/h). These are just at daycares and so on. Two are in sandboxes, one in a field (or garden?).
    http://www.city.funabashi.chiba.jp/information/p015854_d/fil/taiki230705.pdf

    Monday, April 18, 2011

    Hot Schools in Fukushima

    http://atmc.jp/ has added a national radiation map to their existing database which includes air, soil, rain, food. They have also added a map of radiation at Fukushima Prefecture schools, http://atmc.jp/school/ as measured by the Fukushima Prefecture Disaster Office over three days, at present.

    Bad news in this map is that schools in Fukushima City and elsewhere with numbers up around 4 to 6 microsieverts per hour are far above the 20 MILLIsieverts per year the govt is setting as an evacuation threshold. Do the math: Anything over 2.3 MICROsieverts an hour will accumulate to more than 20 MILLIsieverts a year. They should err on the side of caution considering: the intl standard for added dose is 1 millisievert annually, not 20; these are children, not adults; there is a possibility of ingesting and inhaling radioactive particles; and emissions and deposition levels are continuing and accumulating. They should evacuate.

    One argument against evacuation is that these levels may be temporary, and go down soon, but that is doubtful. Even if so, I think they should temporarily evacuate the cities of Fukushima (290,000ppl), Nihonmatsu (61,000ppl), and Sukagawa (80,000ppl), or, if that is impossible, evacuate at least the children. Note that our levels down here in Chiba are 0.055 microsieverts per hour today, only 1% of what is measured at some of those schools. (compare to 5.5)

    If the govt keep to their stated standard of evacuating places with a risk of accumulating over 20millisieverts/year, then they will announce an evacuation. If they keep to their established precedent of moving slowly (and erring on the side of radiation), the announcement will come in about 2 weeks (and allow another month to take effect).

    Using the slider on the school map also reveals wider investigations done on previous days. I guess they are not cumulatively added to the map because yesterday's measurements may have changed by today. There are 2 measurements: at 1cm (above the soil, I assume), and 1 meter.

    Measurements of the known VERY radioactive areas were done mostly on the first day.

    Thursday, December 31, 2009

    Thursday, September 06, 2007

    Earth, Wind, and Water

    I keep watching the projected amount of rainfall from the current typhoon (#9) increase, from 200 mm to 250 mm, to 300, 400, and now 500mm, half a meter. Typhoons usually whisk by us pretty fast by the time they get to this latitude, but this one is being blocked by two areas of high pressure. We have had 2 days of rain already, so another 18 inches or so on top of that could be a problem. Fifty meter per second winds don't sound good either.

    Better than the swarms of earthquakes we had in mid-August, a few dozen of which were in Chiba or close enough to feel.
    http://www.jma.go.jp/en/quake/quake_singendo_index.html
    http://www.jma.go.jp/en/quake/quake_local_index.html

    Issued at Occurred at Region Name Magnitude Maximum Seismic Intensity (JMA)
    17:11 JST 18 Aug 2007 17:07 JST 18 Aug 2007 E OFF CHIBA PREF M4.0 3
    17:04 JST 18 Aug 2007 16:55 JST 18 Aug 2007
    E OFF CHIBA PREF M5.1 4
    17:00 JST 18 Aug 2007 16:55 JST 18 Aug 2007 E OFF CHIBA PREF M5.1 4
    13:40 JST 18 Aug 2007 13:36 JST 18 Aug 2007 E OFF CHIBA PREF M4.6 4
    05:59 JST 18 Aug 2007 05:54 JST 18 Aug 2007 NIIGATA KEN CHUETSU CHIHO M2.2 1
    05:16 JST 18 Aug 2007 05:11 JST 18 Aug 2007 E OFF CHIBA PREF M2.6 2
    04:56 JST 18 Aug 2007 04:52 JST 18 Aug 2007 CHIBA KEN NANBU M3.4 3
    04:43 JST 18 Aug 2007 04:38 JST 18 Aug 2007 E OFF CHIBA PREF M2.5 1
    04:40 JST 18 Aug 2007 04:36 JST 18 Aug 2007 NEAR MIYAKOJIMA ISLAND M3.8 1
    04:36 JST 18 Aug 2007 04:30 JST 18 Aug 2007 E OFF CHIBA PREF M2.7 2
    04:19 JST 18 Aug 2007 04:14 JST 18 Aug 2007 E OFF CHIBA PREF M4.8 5-
    19:14 JST 17 Aug 2007 19:08 JST 17 Aug 2007 TOCHIGI KEN NANBU M2.5 1
    19:11 JST 17 Aug 2007 19:05 JST 17 Aug 2007 NEAR NIIJIMA AND KOUZUSHIMA ISLANDS M2.0 1
    09:48 JST 17 Aug 2007 09:43 JST 17 Aug 2007 AKITA KEN NAIRIKU HOKUBU M3.3 2
    02:16 JST 17 Aug 2007 02:10 JST 17 Aug 2007 TOCHIGI KEN HOKUBU M3.4 2
    00:30 JST 17 Aug 2007 00:25 JST 17 Aug 2007 E OFF CHIBA PREF M3.4 2
    00:26 JST 17 Aug 2007 00:22 JST 17 Aug 2007 E OFF CHIBA PREF M4.3 3
    09:26 JST 16 Aug 2007 09:22 JST 16 Aug 2007 E OFF CHIBA PREF M4.7 3
    08:37 JST 16 Aug 2007 08:32 JST 16 Aug 2007 E OFF CHIBA PREF M4.5 2
    08:35 JST 16 Aug 2007 08:30 JST 16 Aug 2007 E OFF CHIBA PREF M3.2 2
    08:24 JST 16 Aug 2007 08:20 JST 16 Aug 2007 E OFF CHIBA PREF M5.0 3
    07:51 JST 16 Aug 2007 07:47 JST 16 Aug 2007 E OFF CHIBA PREF M4.5 3
    07:46 JST 16 Aug 2007 07:41 JST 16 Aug 2007 E OFF CHIBA PREF M4.0 2
    06:26 JST 16 Aug 2007 06:20 JST 16 Aug 2007 IWATE KEN NAIRIKU NANBU M2.9 1
    05:09 JST 16 Aug 2007 05:04 JST 16 Aug 2007 E OFF CHIBA PREF M4.0 2
    04:26 JST 16 Aug 2007 04:15 JST 16 Aug 2007 E OFF CHIBA PREF M5.3 4
    04:19 JST 16 Aug 2007
    04:15 JST 16 Aug 2007 E OFF CHIBA PREF M5.3 4
    03:37 JST 16 Aug 2007 03:32 JST 16 Aug 2007 IRIOMOTEJIMA ISLAND REGION M3.8 1
    00:17 JST 16 Aug 2007 00:11 JST 16 Aug 2007 E OFF CHIBA PREF M2.7 1
    20:39 JST 15 Aug 2007 20:34 JST 15 Aug 2007 E OFF CHIBA PREF M3.8 1
    19:40 JST 15 Aug 2007 19:34 JST 15 Aug 2007 IWATE KEN ENGAN HOKUBU M4.2 2
    18:48 JST 15 Aug 2007 18:44 JST 15 Aug 2007 TOKACHI SHICHO CHUBU M3.4 3
    18:16 JST 15 Aug 2007 18:11 JST 15 Aug 2007 E OFF CHIBA PREF M2.6 1
    12:13 JST 15 Aug 2007 12:09 JST 15 Aug 2007 E OFF CHIBA PREF M3.0 1
    11:13 JST 15 Aug 2007 11:08 JST 15 Aug 2007 OFF MIYAGI PREF M3.8 2
    09:28 JST 15 Aug 2007 09:23 JST 15 Aug 2007 E OFF AOMORI PREF M3.8 1
    07:43 JST 15 Aug 2007 07:38 JST 15 Aug 2007 OFF JO-CHUETSU NIIGATA PREF M2.5 1
    03:44 JST 15 Aug 2007 03:39 JST 15 Aug 2007 AKITA KEN NAIRIKU NANBU M3.0 1
    02:48 JST 15 Aug 2007 02:43 JST 15 Aug 2007 NARA KEN M2.7 1
    02:33 JST 15 Aug 2007 02:28 JST 15 Aug 2007 E OFF CHIBA PREF M2.8 1
    21:38 JST 14 Aug 2007 21:33 JST 14 Aug 2007 E OFF CHIBA PREF M3.0 2
    16:52 JST 14 Aug 2007 16:45 JST 14 Aug 2007 OFF IWATE PREF M3.6 1
    13:22 JST 14 Aug 2007 13:14 JST 14 Aug 2007 W OFF SAKHALIN M5.9 2
    15:53 JST 13 Aug 2007 15:47 JST 13 Aug 2007 SE OFF TANEGASHIMA ISLAND M4.3 1
    12:39 JST 13 Aug 2007 12:34 JST 13 Aug 2007 OFF MIYAGI PREF M4.0 1
    11:21 JST 13 Aug 2007 11:16 JST 13 Aug 2007 E OFF CHIBA PREF M2.6 1
    09:35 JST 13 Aug 2007 09:30 JST 13 Aug 2007 E OFF CHIBA PREF M3.0 1
    07:27 JST 13 Aug 2007 07:22 JST 13 Aug 2007 NEAR NIIJIMA AND KOUZUSHIMA ISLANDS
    M1.9 1
    06:28 JST 13 Aug 2007 06:22 JST 13 Aug 2007 SE OFF TANEGASHIMA ISLAND M3.8 1
    15:22 JST 12 Aug 2007 15:17 JST 12 Aug 2007 NEAR OKINAWAHONTO ISLAND M4.0 2
    10:02 JST 12 Aug 2007 09:56 JST 12 Aug 2007 OFF FUKUSHIMA PREF M3.8 1
    08:19 JST 12 Aug 2007 08:13 JST 12 Aug 2007 NEAR IZU-OSHIMA ISLAND M2.0 1
    01:58 JST 12 Aug 2007 01:49 JST 12 Aug 2007 HIROSHIMA KEN HOKUBU M2.6 1
    01:54 JST 12 Aug 2007 01:48 JST 12 Aug 2007 E OFF OSUMI PENINSULA M4.3 1

    Tuesday, March 20, 2007

    Flood Maps


    Flood Maps, by Alex Tingle, show the effects of sea level rise of up to 14 meters in Google Maps. You can set the sea level rise for the best estimate you have. My neighborhood is still above water, but Chiba has become an island, with perhaps a bridge or tenuous causeway to the rest of Honshu, and most of the east side of Tokyo is underwater. I understand the White House will be waterfront property in the 14 m scenario. If the entire mass of the polar ice caps melts, sea level rises could be much more than this, but that may occur over several centuries. The old city of Funabashi will go underwater and Higashi Funabashi will be a beach area. Water comes up on several sides of Tsudanuma station.


    Update 2007-03-20:
    I should mention that a complete polar meltdown to ice-free status would raise sea level by around 80 meters, 73 meters contributed by Antarctica and 6 meters contributed by the already-melting-and-likely-to-accelerate Greenland, according to the USGS. Historically ( in geological history), this is not unusual. I also like to point out that sea level was 130 meters lower in the last ice age, 18,000 years ago, and only neared the present levels 8,000 years ago, not so much earlier than the construction dates of early pyramids 4600 years ago. Thus a rise or fall in sea levels of tens or hundreds of meters should not be beyond our imaginations, but the poverty of imagination is one of the great resource scarcities of this time.
    The inside of the Yamonote Line would still be above water after a sea level rise of 14 m. One could conceivably board a speedboat shuttle near Tsudanuma or Higashi-Funabashi to commute to a disembarkation point somewhere between the Akihabara and Ginza waterfronts. Tokyo Bay submerges "shitamachi" areas and extends far beyond Saitama City, halfway to Maebashi, Gunma.

    NASA and Google should be credited for the data which Alex Tingle so elegantly programs and displays.

    In order to view sea level rises above 14 meters as well as negative numbers, try http://kirk.caset.buffalo.edu/~depape/topo/


    or try running the Java applets of Sebastien Merkel at http://merkel.zoneo.net/Topo/Applet/
    I have trouble understanding some of Merkel's figures: How could sea level have been 300 meters higher 95 million years ago and 600 meters higher 450,000,000 years ago -- unless the earth is losing water to space?

    Check out Japan without the Kanto Plain, just the Kanto fishing grounds. Part of the Boso peninsula has survived as an island. This is an 80-meter sea-level rise, the result of ice-free polar regions. (By the way, I tweaked the gamma, contrast, and saturation to make the screen shot of the Java applet more vivid.)

    One final alternative for similar explorations: The University of Arizona.

    Saturday, February 10, 2007

    Cedar Pollen 杉の花粉 (Revenge of the Trees)

    The sneezing and burning sensations in the nose and eyes, similar to low-level tear-gas or pepper spray exposure, which residents of Japan may feel beginning right about now is the conjunctivitis and rhinitis symptomatic of kafunsho, 花粉症, or pollenitis. This epidemic is the unfortunate result of a large-scale cedar reforestation miscalculation in the early post-war era which led to massive quantities of pollen per cubic centimeter. Dense stands of cedar-only forests covering 12% of the national land area led to production of absurd levels of pollen. Not only are they much denser than a natural forest, but being all the same species packed together causes each tree to vastly escalate its pollen production to compete with neighboring trees. At the same time, the population became highly sensitized to allergic reactions due to sanitation (i.e. nobody has worms anymore, which gave a natural protection against kafunsho). It has been found to affect monkeys, too.

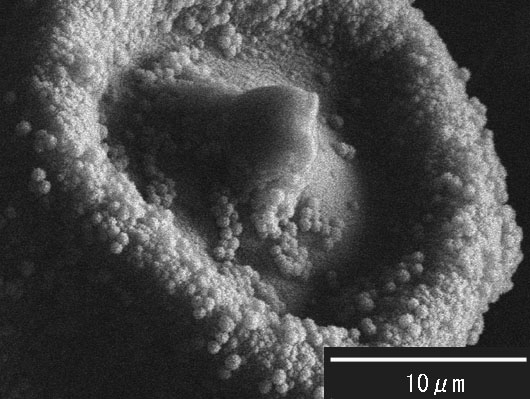
    I have added some quick kafun 花粉 (pollen) reference items to the sidebar for quick reference, with a bias toward Kanto, Tokyo and Chiba, although navigating up a level from http://yklt.kafun-info.jp/html/kanto_s.html to http://yklt.kafun-info.jp/html/ will get you to a national pollen map courtesy of Yakult(!?), for example. This kafunsho season, not unlike a protracted cold, will last from mid-February to early May. Sometimes you can see the thick clouds of pollen blowing off the trees, or you can see it on the windshield of a car or anywhere where it would gather such as a windowsill. They look to be about 30 microns (30,000 nanometers) wide. Maybe. Here are some magnified pictures at 2500X. Here's an electron microscope image from here. Right is a picture from an Osaka government site.

    I use a variety of methods to cope. First of all, the prophylactic principle is most effective. This means wearing a surgical mask to block as much pollen as possible. That cuts the symptoms by
    25-75%. Next, eat all the pills your doctor gives you. This will have the unfortunate effect of making you borderline narcoleptic, able to sleep on a dime at anytime by just closing your eyes, if you aren't that tired already. That induced drowsiness is nice; since you feel miserable anyway, who needs consciousness? A third way to fight the pollen is with eye drops and nasal spray. I checked out the eye drops and found they were made of the usual anti-red-eye ingredient, the name of which I have forgotten. I found that the active ingredient of my nasal spray was hydrochloric acid. When your sinuses are completely blocked, yet oozing nasal mucus profusely, hydrochloric acid seems like it may be just the thing. I'll trust the judgment of the medical community. I would like to have some goggles since my eyes itch like crazy. I have often thought that oxygen tanks and an oxygen mask wouldn't really be such a bad idea. It could actually be an improvement on the surgical mask and goggles to have a transparent glass oxygen mask, or just go all the way and cover the head with a transparent helmet with positive air pressure from a clean supply. This would interfere with eating and drinking, but keep pollen out of your hair, too. You would want to take it off occasionally. If it were made lighter, either a gauzy veil-like envelope or a clear plastic type resembling a plastic bag over the head, that would have some advantages, too.

    The very best solution is rain. Rain cleanses the air of all the organic and inorganic crap. If it rains, you get immediate relief. You will know when you wake up if the rain has stopped or started. Wind is the worst. I'll be hoping for rain until May. Last year, the rainy season began from May (instead of June).

    Thursday, September 07, 2006

    Earthquake Weather

    We had an earthquake here a few minutes ago. Apparently I slept through a 4.9 M at 3 a.m. too. This was a 4.4. That's pretty minor, but it was close, so we had the fine up and down shaking of the p-wave, very crisp and sharply defined, followed closely by the s-wave with its more funky low-key dance vibe. NHK tv reported it as centered in Kanagawa before deciding a few minutes later that it was centered in Chiba. Somehow Kanagawa and Ibaraki shook as much or more than the epicenter. The Meteorological Agency seemed to have the fastest reports, so check there or NHK for best results. http://www.jma.go.jp/en/quake/ You may wonder why tectonic movements are part of the weather service, but there actually is some relationship, such as quakes occuring during winter high pressure, and the phenomenon of earthquake clouds. I checked the USGS for weather reports but there seems to be a clearer division of labor in the US; the USGS is not allowed to forecast or report the weather.