Showing posts with label chart. Show all posts

Wednesday, February 29, 2012

Seismic record

http://www.kyoshin.bosai.go.jp/kyoshin/topics/html20110311144626/main_20110311144626.html

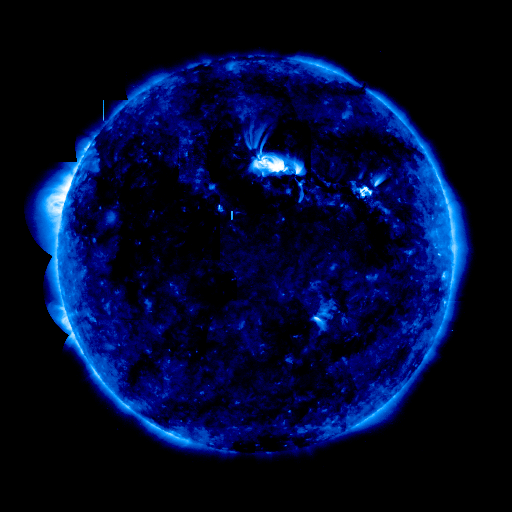
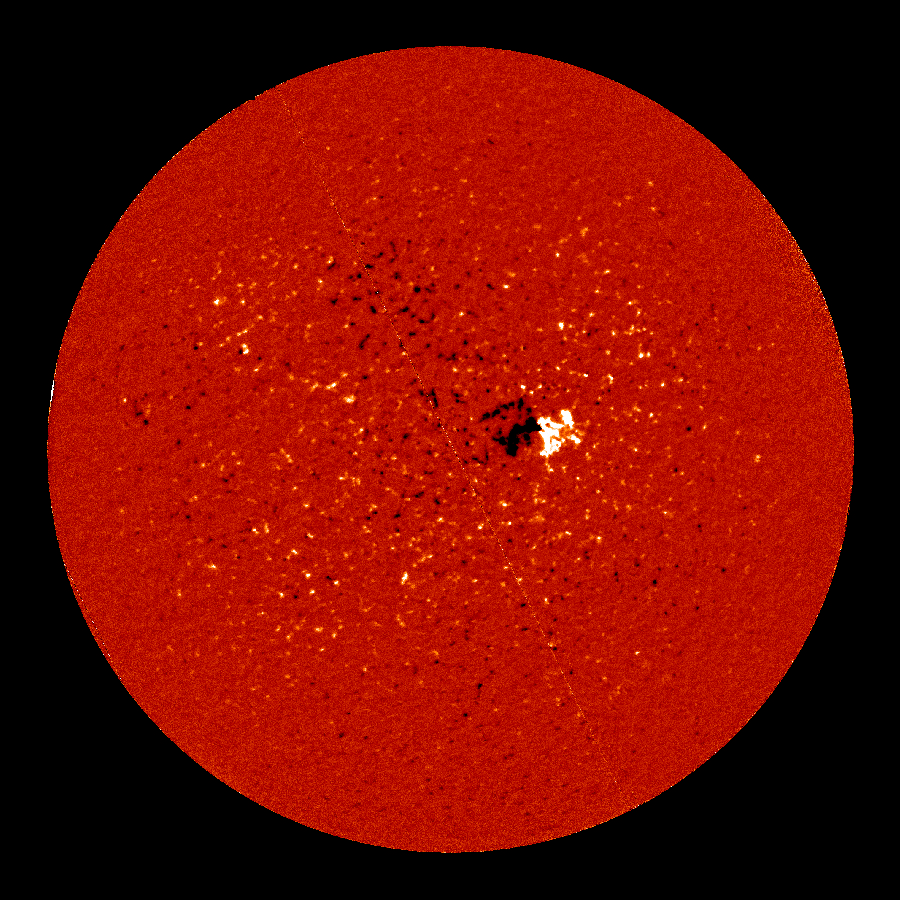
Here are some seismic records, in case you want to use the recording on a large turntable-like device to re-play earthquakes.

One thing I still find amazing yet absolutely accurate is that 5 minutes after the start of the earthquake it is still rocking at an intensity of Shindo 3 over a wide area. 

Wednesday, February 10, 2010

WTF'in' around with QR-codes

I've been listening to WTF with Marc Maron, as mentioned in a previous post. I've gone through most of the backlog and have to conclude that this is a better situation for Marc in that he is producing better, more timeless and higher-quality comedy-centered content now.

I tried to integrate a QR code into the (existing WTF) show graphic, so I could learn how to use the G.I.M.P. a little more, and maybe even contribute something back to Marc.

I used the Google chart API to make a URL like this or this with error correction level H (allowing 30% of the code to go missing).
My first idea was to go with Marc's face. Hmmm. It's not great but I suppose his face would be enough to remind people what the link was for.
My second attempt was the weirdo-at-the-screendoor effect, in 2 versions. Git yer gun, Pa!

(click for full size)
It doesn't really work unless you see it at full size; the grid doesn't scale.
I tried this blue 600 pixel hippie gif because I didn't like the Huck Finn quality of the existing letters WTF.
I'm not really satisfied with any of these. All of this "code" may be out of date soon as you can apparently just point your cellphone camera at buildings and things and have them recognized.

BTW, since I was working on this in the presence of a 7-year old, WTF now stands for Where's the fish?, What's that fish?, or What's that for?

This final one looks like it wouldn't work, but it scans in very quickly.

The GIMP is better than Photoshop. It's almost the same ease of use (if you start from zero), is cheaper at 0 yen vs $700, and is guilt-free for pirates. And although I personally like the gimpy-sounding name, I would propose the next version be called "The PIMP", Photographic Image Manipulation Program, or Professional Image Manipulation Program, to satisfy the people who are uncomfortable with the name. Hell, why even wait for someone else to change the name? Change the branding yourself just for your own personal use. The Windows version should go with the WIMP as the name, and perhaps The ChIMP would be appropriate for Christians or anyone who can think of a good acronymical reason for that.

Friday, November 06, 2009

Supercomputing with Penguins

I hadn't realized that most of the world's supercomputers were running Linux (as of June 2009). When did that happen? Apparently between late 2003 and early 2004 Linux began to displace the Unix memes from their virtual niche in the supercomputing ecosphere. I don't know the history, but the shift is so fast it suggests that Linux became more efficient and was adopted en masse by supercomputer admins. Or I suppose it could be a licensing thing. Anyway, Linux was adopted because it was better for one reason or another.

Victory over all in the supercomputing field doesn't necessarily mean Linux is headed for supremacy on the desktop, but it's still a good sign. By the way, Top500.org has some interesting charts, historical graphs, and tables you can generate.

Saturday, January 24, 2009

Google Charts QR-Code API

Google charts dynamically generates various kinds of charts as you need them--right in your browser or on a web page. Venn diagrams, bar graphs, pie graphs, and even maps are available! An interesting one is the dynamic generation of QR codes. A very appealing feature is that you can set the EC (error correction) level on these. I didn't see this in other online QR code generators. EC level H allows your code to be readable even if 30% of your code is obscured. That should be ideal for the purpose of embedding it in a manipulated image. It compares to the default level L, which only allows 7% of the data to be restored. Version number is set automatically depending on your request. I'm a little drunk now, so I may not be able to summarize it very well. Al Khahol can make you geeky (cuz it definitely don't make you sexy (unless the opposing party is even more drunk)).
Basically, you start with
http://chart.apis.google.com/
and add the chart type (cht)
chart?cht=qr
to indicate you are making a QR chart. Then you can add the other specifications or parameters, such as size. You can't get much smaller than 40 for a QR code, and I'm not sure what the upper limit is… (177x177 -- but you could be using multiple pixels per bit). Suppose it's 200x200.
&chs=200x200
That (chart size, chs) is obligatory. The output encoding default is UTF8 so you don't really need to add that. You could encode you Japanese kanji using Shift_JIS
&choe=Shift_JIS
otherwise you can leave it out. ISO-8859-1 is also available, whatever the hell that is.
Specify the L, lingual string(?) with
&chl=your text string here
Then my favorite part ,
chld=<L, M, Q, or H>|
This is the EC and margin, where you can specify error correction and margins, according to Google,

Four levels of error correction (EC) are available. The default level (L) allows the QR code to be read even if up to 7% of the code is misread, missing, or obscured. Other levels provide error correction for codes where up to 30% of the code cannot be read. The number of characters that can be encoded decreases as the EC level increases. See Versions, error correction and maximum characters for details.

The default margin is 4 modules. This means that a blank space equivalent to four rows at the top and bottom and four columns on the left and right is placed around the QR code. This is the minimum required by QR readers.

Optionally, specify an EC level and margin with

chld=|
Where:
is one of the following:

L allows 7% of a QR code to be restored

M allows 15% of a QR code to be restored
Q allows 25% of a QR code to be restored
H allows 30% of a QR code to be restored
and
defines the margin (or blank space) around the QR code. The default image has a margin equivalent to 4 rows / columns of the chart.
examples:

http://chart.apis.google.com/chart?cht=qr&&chs=240x240&chl=http://www.blues-tea-cha.blogspot.com/&chld=L|2
looks like

while
http://chart.apis.google.com/chart?cht=qr&&chs=240x240&chl=http://www.blues-tea-cha.blogspot.com/&chld=H|2
looks like

http://chart.apis.google.com/chart?cht=qr&chs=50x50&chl=http%3A%2F%2Fwww.blues-tea-cha.blogspot.com&chld=%3CH%3E|%3C2%3E
Some characters will change in the browser URL to appear as follows:
http://chart.apis.google.com/chart?cht=qr&&chs=50x50&choe=UTF-8&chl=http://www.blues-tea-cha.blogspot.com/&chld=%3CH%3E|%3C2%3E

so don't be confused.

If you type
http://chart.apis.google.com/chart?cht=p3&chd=t:90,1
0&chs=440x220&chl=Pacman|ghost
you get


Even more interesting is maps. For example, type (or cut and paste) http://chart.apis.google.com/chart?cht=t&chs=400x200&chd=s:_&chtm=world into your browser (or insert on your web site) and this map will appear.


440x220 seems to be the maximum size.
http://chart.apis.google.com/chart?cht=t&chs=440x220&chd=s:_&chtm=usa